The 'Futsal Mania' app!
Right after I’ve set up my (this) new blog I started to handle some data regarding futsal sport. It was for fun in the beginning, and my curiosity about the team’s performance along the national competitions was getting higher and higher. About a two weeks ago started the LNF 2016 season here in Brazil. And for some reason I wanted to get this app running on live right away. And so I focus to accomplish that! And I did it! :-)
[ you can check it out the app here FUTSAL MANIA ]
The hard time was to figure it out the ‘right’ names for the teams, since it is quite usual in this competition to have compound names because their new sponsors. For example, in 2014/2015 seasons the team of Sorocaba was also called as Brasil Kirin. This 2016 season they have a new sponsor and now they are being called as Magnus Futsal. Yes, I know! :/ This is really terrible for gathering data… but still is not impossible do arrange that! And as older the seasons, more problems with their names.
In general, I tried to keep the most known name of them. For the example above, the oficial name I set for the team of Sorocaba city was ‘Sorocaba’, regardless of their sponsors at that time.
Unfortunately, I was only able to find data regarding the games since LNF 2010. Before that, I still didn’t find any reliable source. Still diggind the web for that… not even LNF oficial association could help me on that. They indeed have all the data, but still the most part of them are not digital yet, so. They told me they have a project running to change that, but it is going to take time. Let’s wait then.
But let’s start talking about the interesting part… the data and how R/Shiny could help me turn my ideas in reality! :D
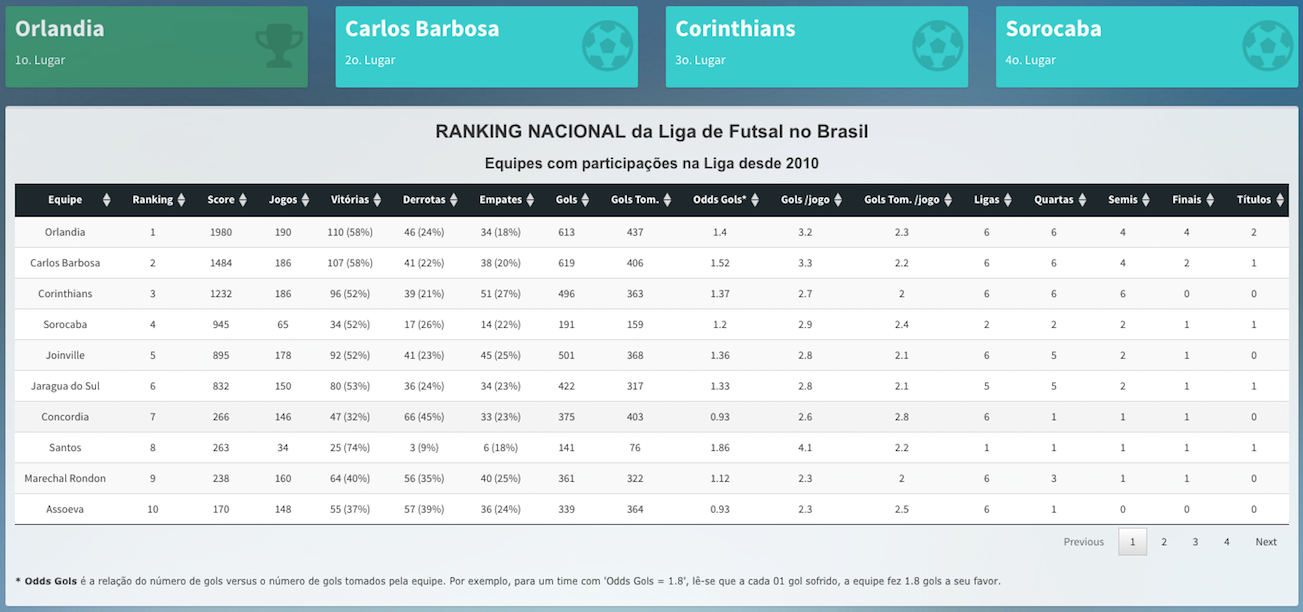
Basically, the most of the work (so far!) was all about munging the data and cleaning it. I focused to create a score to measure the perfomance of the teams at each season and then combine them to get an overall (actual) score. My first goal was to have the first ranking of the LNF’s teams in Brazil, considering all their history and performance results in these competitions.
Here it is a screen shot of this ranking…
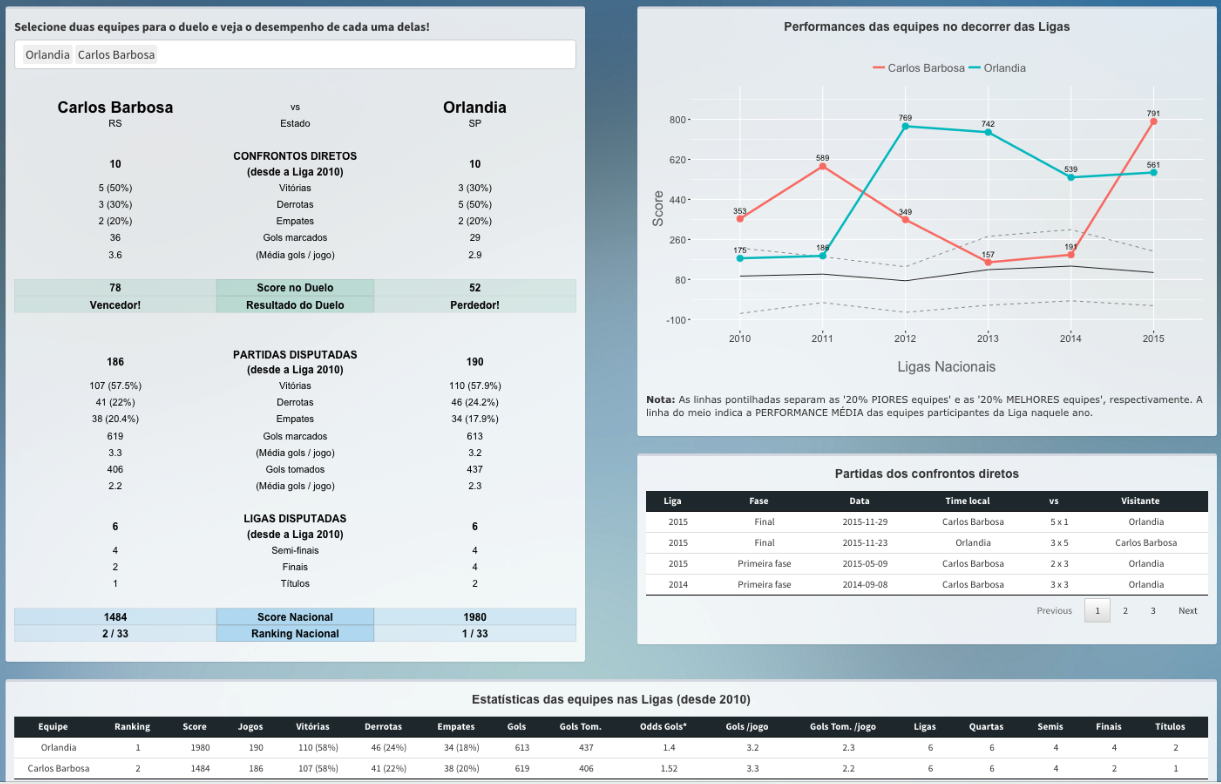
My second goal was to analyse the duel between two teams, the most important statistics involving them (the duel) and also their history in the competition. And this is the result…
And now, once the app are fully running I can play around with all the data available, share some analysis with my friends and just have fun about it!
You can play around with this app in FUTSAL MANIA. I intend to keep it updated regarding the new games from now on. And also want to implement some new features and analysis.
To write this app I used the following packages in server side:
library(gridExtra)  # graphics
library(ggplot2)    # graphics
library(grid)       # some functions used in ggplot
library(rdrop2)     # dropbox integration
library(DT)         # data table presentation in shiny
library(data.table) # data manipulation
And in ui side:
library(shiny)
library(shinydashboard)
library(shinyjs)
My strategy to keep the data updated (periodically) was by dropbox integration. The rdrop2 library is pretty handy to deal that. The data.table library made a lot of difference too. Their performance for data manipulation is very higher if compared to R basis. Well, that’s true ins most of the cases! During this work I found an interesting issue with data.table when you have to use cbind function. Actually, its performance for this is surprisingly worse the R basis! So if you need to cbind columns I advice you to turn your data frame to data.frame format first, then cbind your column(s), and then back to data.table format. It’s quite annoying, but is worth it. This is probably an issue that I hope to be handled in next versions of data.table package.
That’s all folks! ;-)